made with Laravel
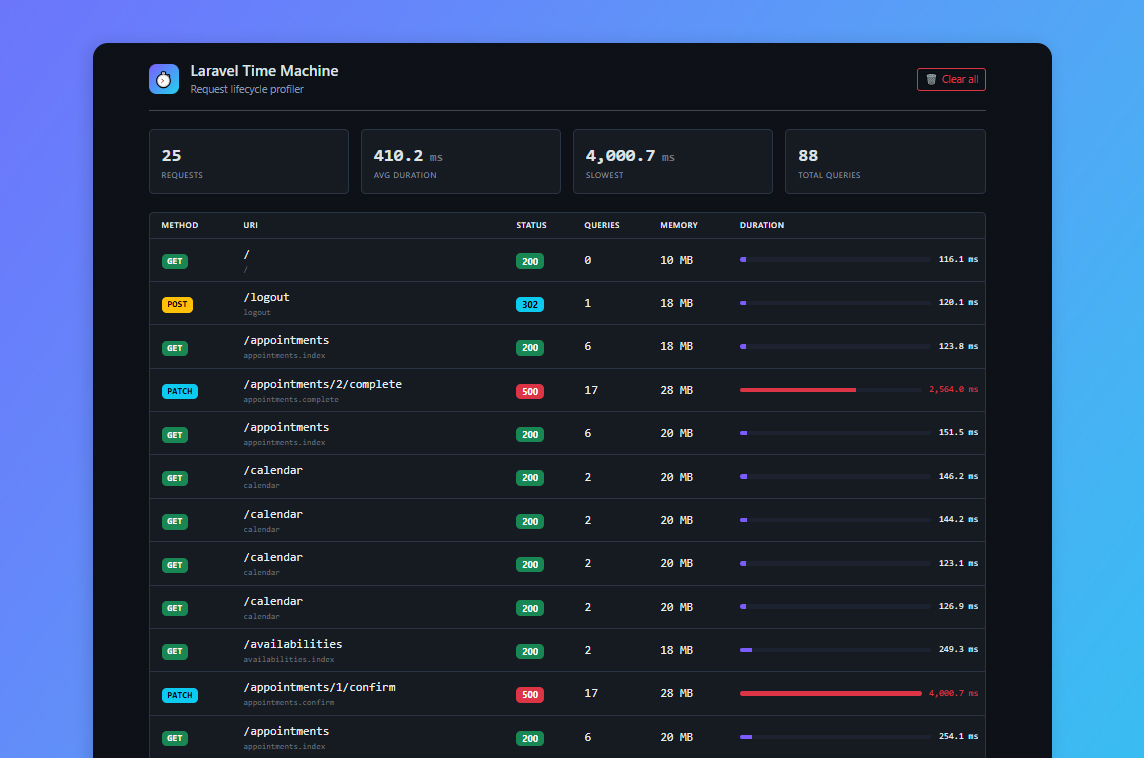
Description
Request Lifecycle Profiler & Performance Debugger
"Profile, debug and visualize every Laravel request from framework boot to response with a millisecond-accurate Gantt timeline, full SQL query profiling and a beautiful zero-config dashboard.
Laravel Time Machine is a lightweight, drop-in Laravel performance profiler and request debugger. It answers one simple question that every developer asks – "Where did all the time go in this request?" – by breaking down the complete request lifecycle into a clear, interactive timeline. Find slow queries, N+1 problems, heavy middleware and sluggish controllers in seconds, without adding a single line of setup code."
Creator
Jaydeep Gadhiya
-

- 📊 Statistics
- ✏️ Request update