How are AI agents going to use our software? That question went from philosophical to very concrete for us. In a team discussion about an agent-first future, we half-jokingly decided we need to expand from UX to AX (agent experience): Optimize our product so agents want to use us. When we later launched our MCP server to better support AI workflows, we realized we had no idea what was even happening inside it.
So, what do agents experience when using our product? We wouldn’t know!
APIs, AI and AX
My team and I run an API-first product. AI has empowered many people to use us in their workflows. But honestly, LLMs really suck at writing API requests if they just run with the API docs. We can see it in the number of support requests featuring hallucinated parameter names and verbose request structures that have nothing to do with our specs.
That’s frustrating for everyone involved: For our users, for me in customer support and probably for the agent as well.
To make our creative automation API easier to use with AI, we added an MCP integration. It provides pre-built tools that agents can use to reliably generate deterministic images, PDFs and videos from templates. AI adds the capabilities it excels in: Take natural language prompts, parse intent and decide what to fill into the dynamic layers before rendering.
Our MCP server setup
The placid.app MCP integration provides a hosted MCP server that users can configure to include only the tools they need (to optimize context size). It’s Laravel-based, using the standard MCP protocol over HTTP. Agents can use tools to search through the user’s templates, understand their layers and trigger renders.
After launching, we loved it and early adopting users loved it – but did agents love it? They’re not giving any feedback (yet). And we didn’t know anything about usage or performance:
- Which tools are they using?
- Were tool calls failing? How often?
- Are they fast enough?
To optimize AX (and ultimately also optimize for token efficiency), these infos would be valuable.
The problem: MCP is a black box
Unfortunately, the standard MCP tooling doesn't give you any structured visibility into runtime behavior. The server handles JSON-RPC requests from agents, but there is no built-in logging for tool calls, success rates or latency.
Since we’re using Sentry’s application monitoring for everything else, it also tracked our HTTP layer, but the MCP tool calls were invisible inside those transactions. Every request just looked the same - even more so since our MCP server routes directly to our existing REST API.
(Disclaimer: Sentry is sponsoring madewithlaravel.com, but we have been using it forever!)
The solution: A custom MCP tracing middleware
To better understand what’s happening in our MCP, we looked at Sentry’s AI and MCP monitoring tools. At the time of us implementing it, they offered MCP SDK integrations for Python and JavaScript.
These integrations automatically capture spans at each MCP interaction (like a tool call). Think of spans as a structured log entry with a start time, duration and metadata such as inputs, outputs and exceptions. The results are shown in a dedicated MCP dashboard reporting on server activities, performance metrics and tool calls.
Sounds great - now for Laravel please?
Bridging the gap for Laravel MCP observability with Sentry
There was no native PHP MCP integration for Sentry yet, but we didn’t want to wait. Our solution was to write a Laravel middleware that creates the spans for each MCP operation manually, following Sentry’s MCP monitoring conventions.
What are we tracking
Per span, our middleware should track:
- The MCP method (
tool/call,resources/read,prompts/get) - The specific tool, resource or prompt called
- Success or failure (via JSON-RPC error detection)
- Metadata of the tool result (error flags, content count)
- The user making the request
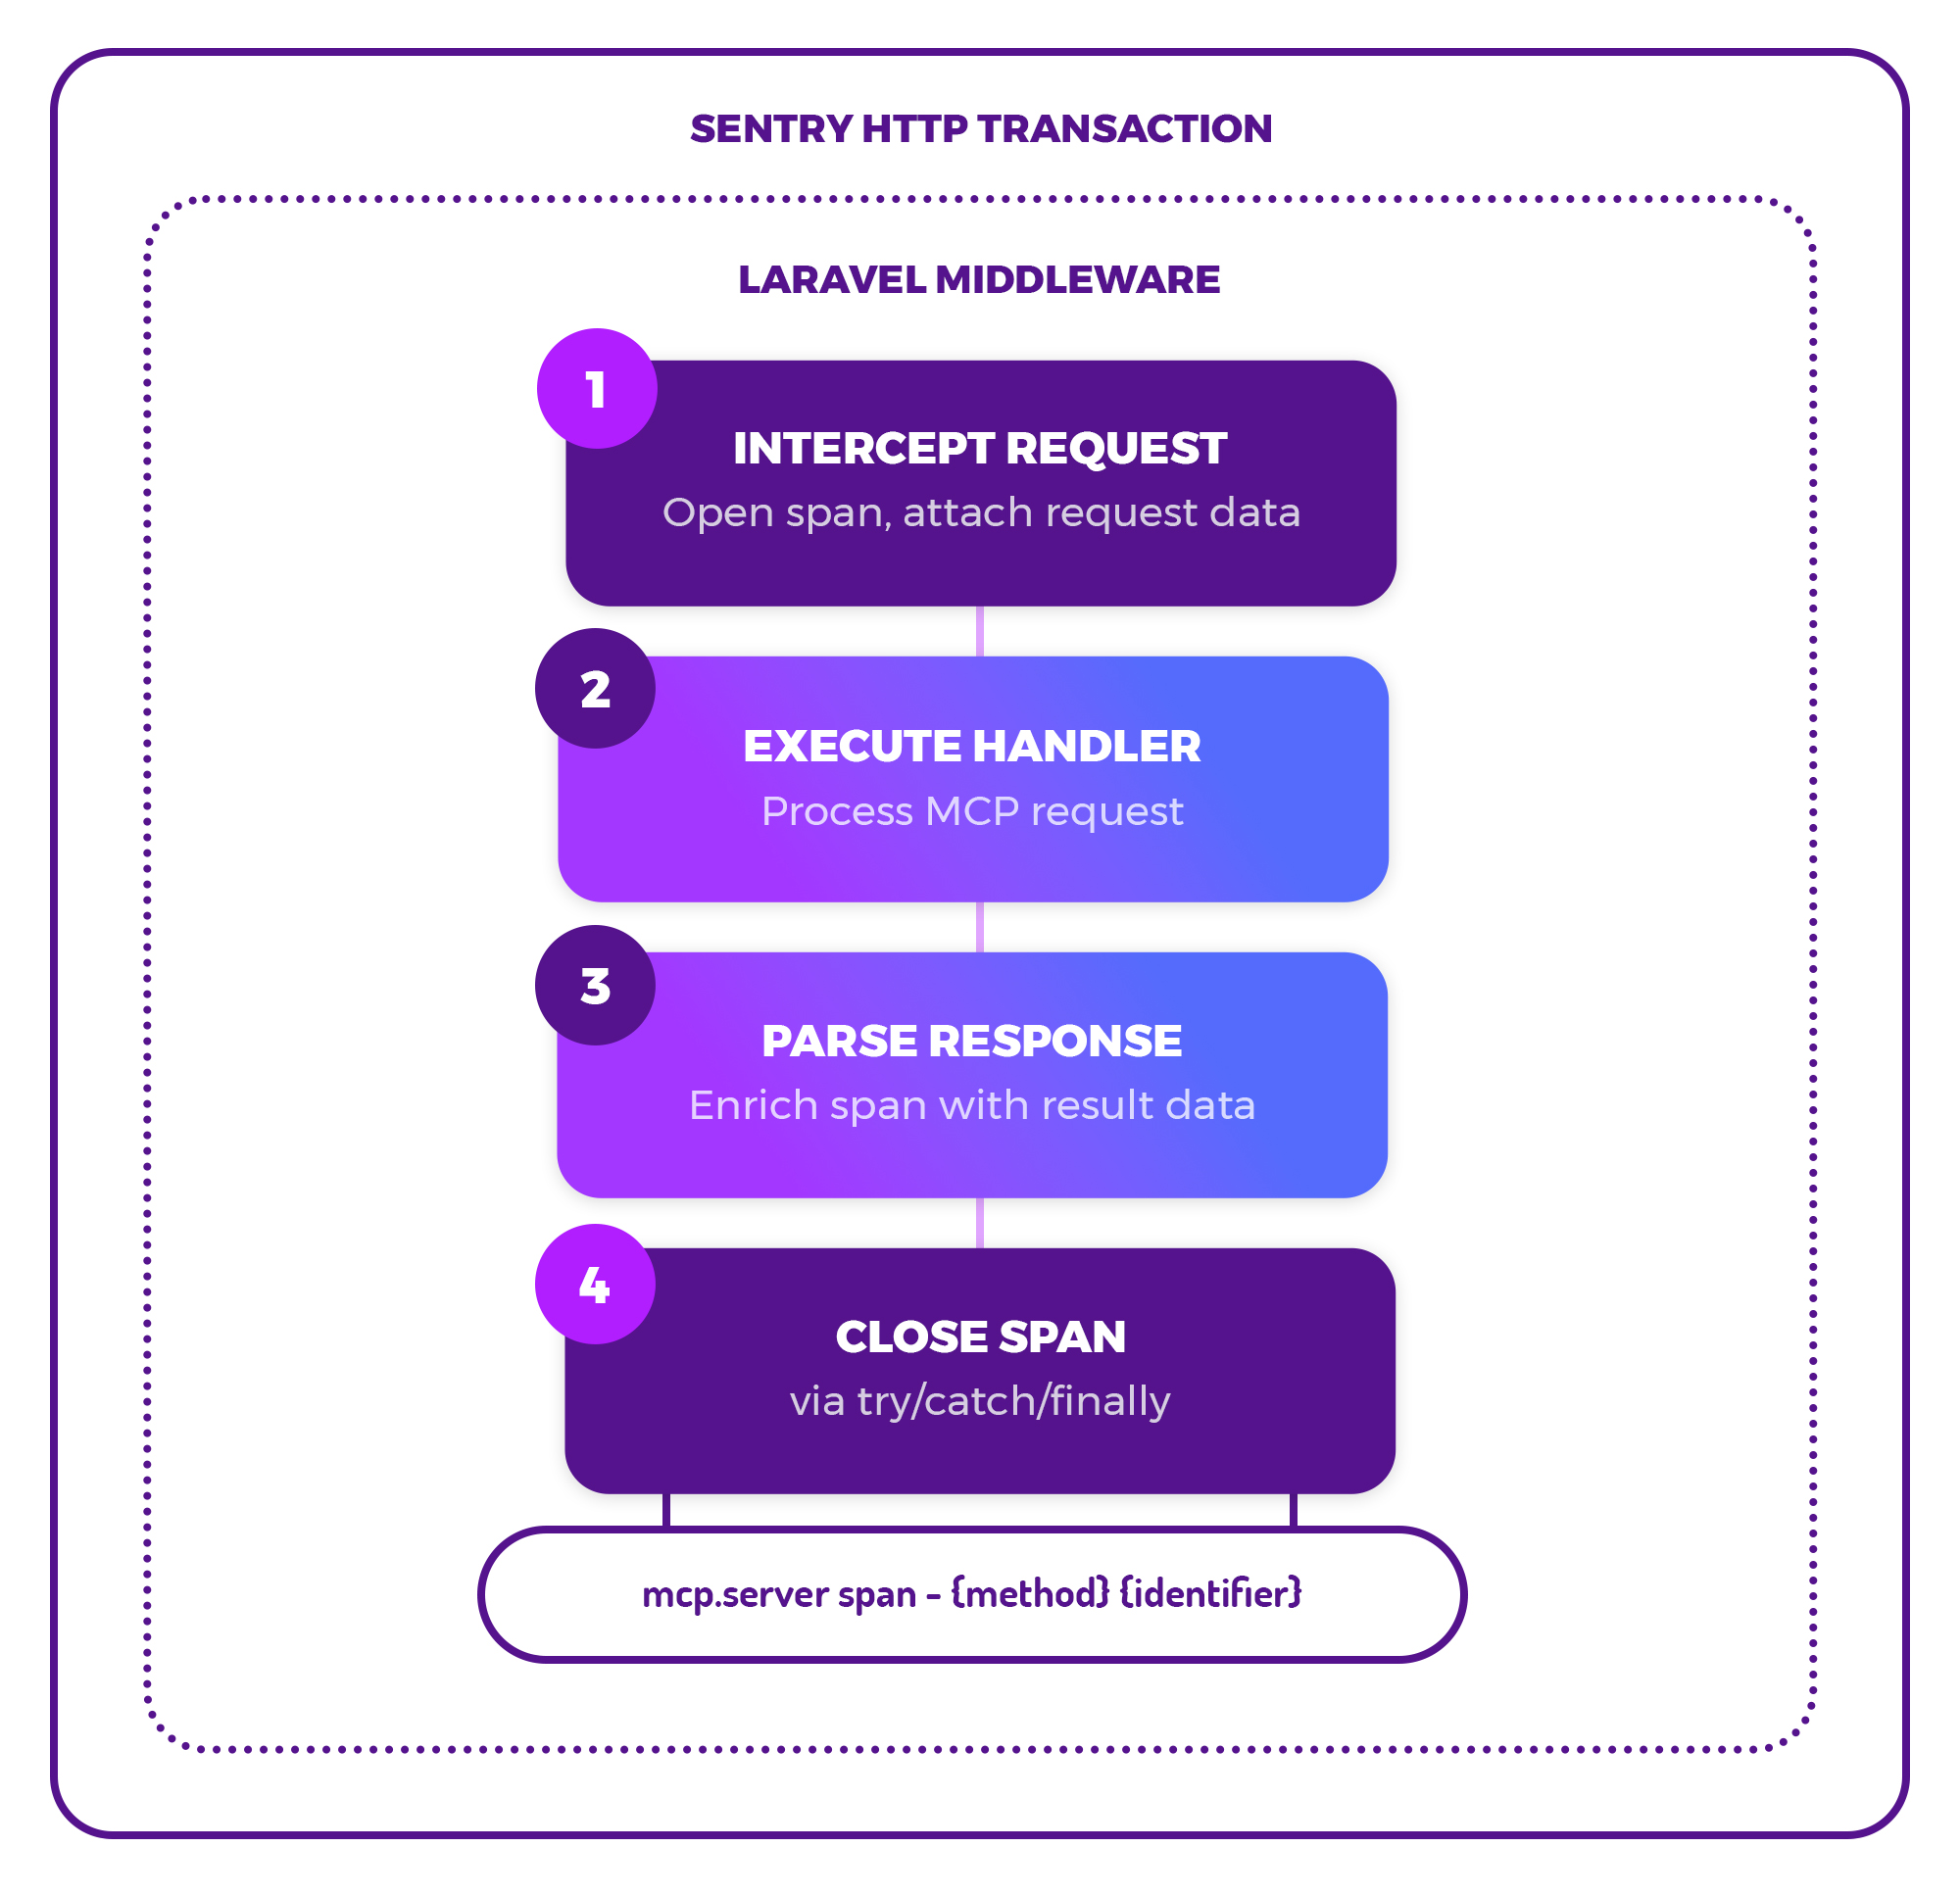
1️⃣ - Intercept the request & create a span
To achieve that, our middleware intercepts the MCP request before our server handles it, and opens a span, attaching the request-level data we already have. Sentry wraps each HTTP request in a so-called transaction – our middleware adds the MCP-level spans as children inside of those.
With this approach, we don’t trace agent workflows across multiple steps, but stay at the tool call level by design. For us, that’s a practical approach to better debug failures for individual image / PDF / video renders.
2️⃣ - Execute the handler
The MCP handler is then executed to process the request, and we wait for the response.
3️⃣ - Parse the response & add data to the span
The response (regular or streamed) is parsed to extract and attach the rest of the metadata we need to the span.
4️⃣ - Close the span
Finally, the span needs to be closed. That needs to happen even if an exception occurs, so we’re using try/catch/finally blocks.
So far so good – that’s how it works conceptually. To take a deeper look at exactly how the code works, you can peek at it in this gist!
What we can see now
Once implemented, the same transactions in Sentry showed up with mcp.server spans showing tool names, durations and status.
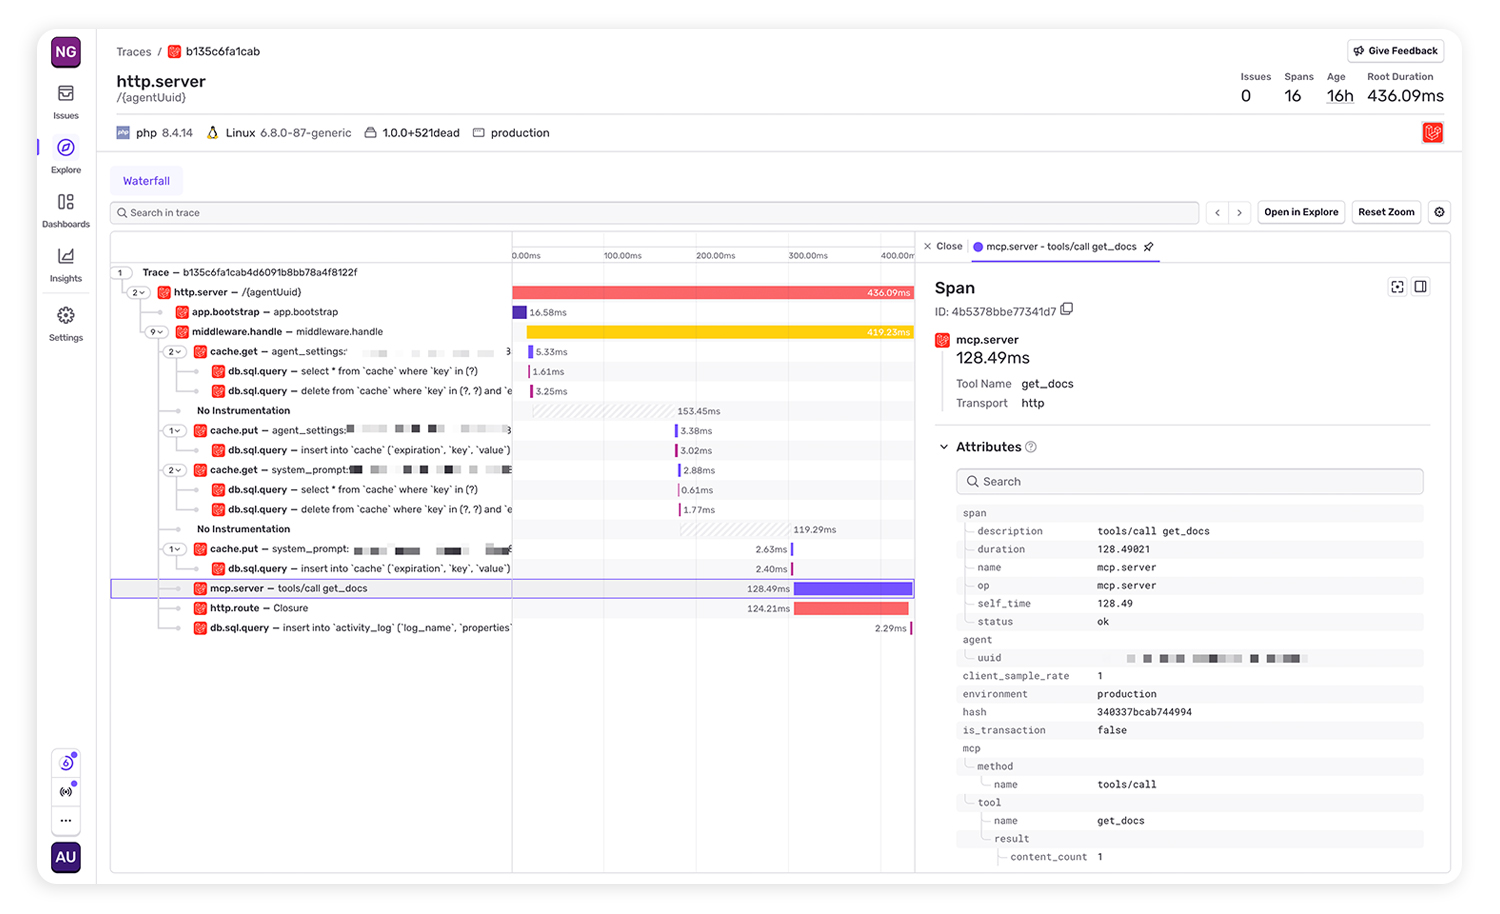
Now we get a better picture of MCP usage and have reporting around:
- 📦️ Which MCP tools are called most (and which are never used)
- 🤖 Which clients and projects generate the most traffic
- 💥 Errors & error rates per tool
- ⏱️ Latency per tool call
- 🐌 Slow tool calls that need optimization
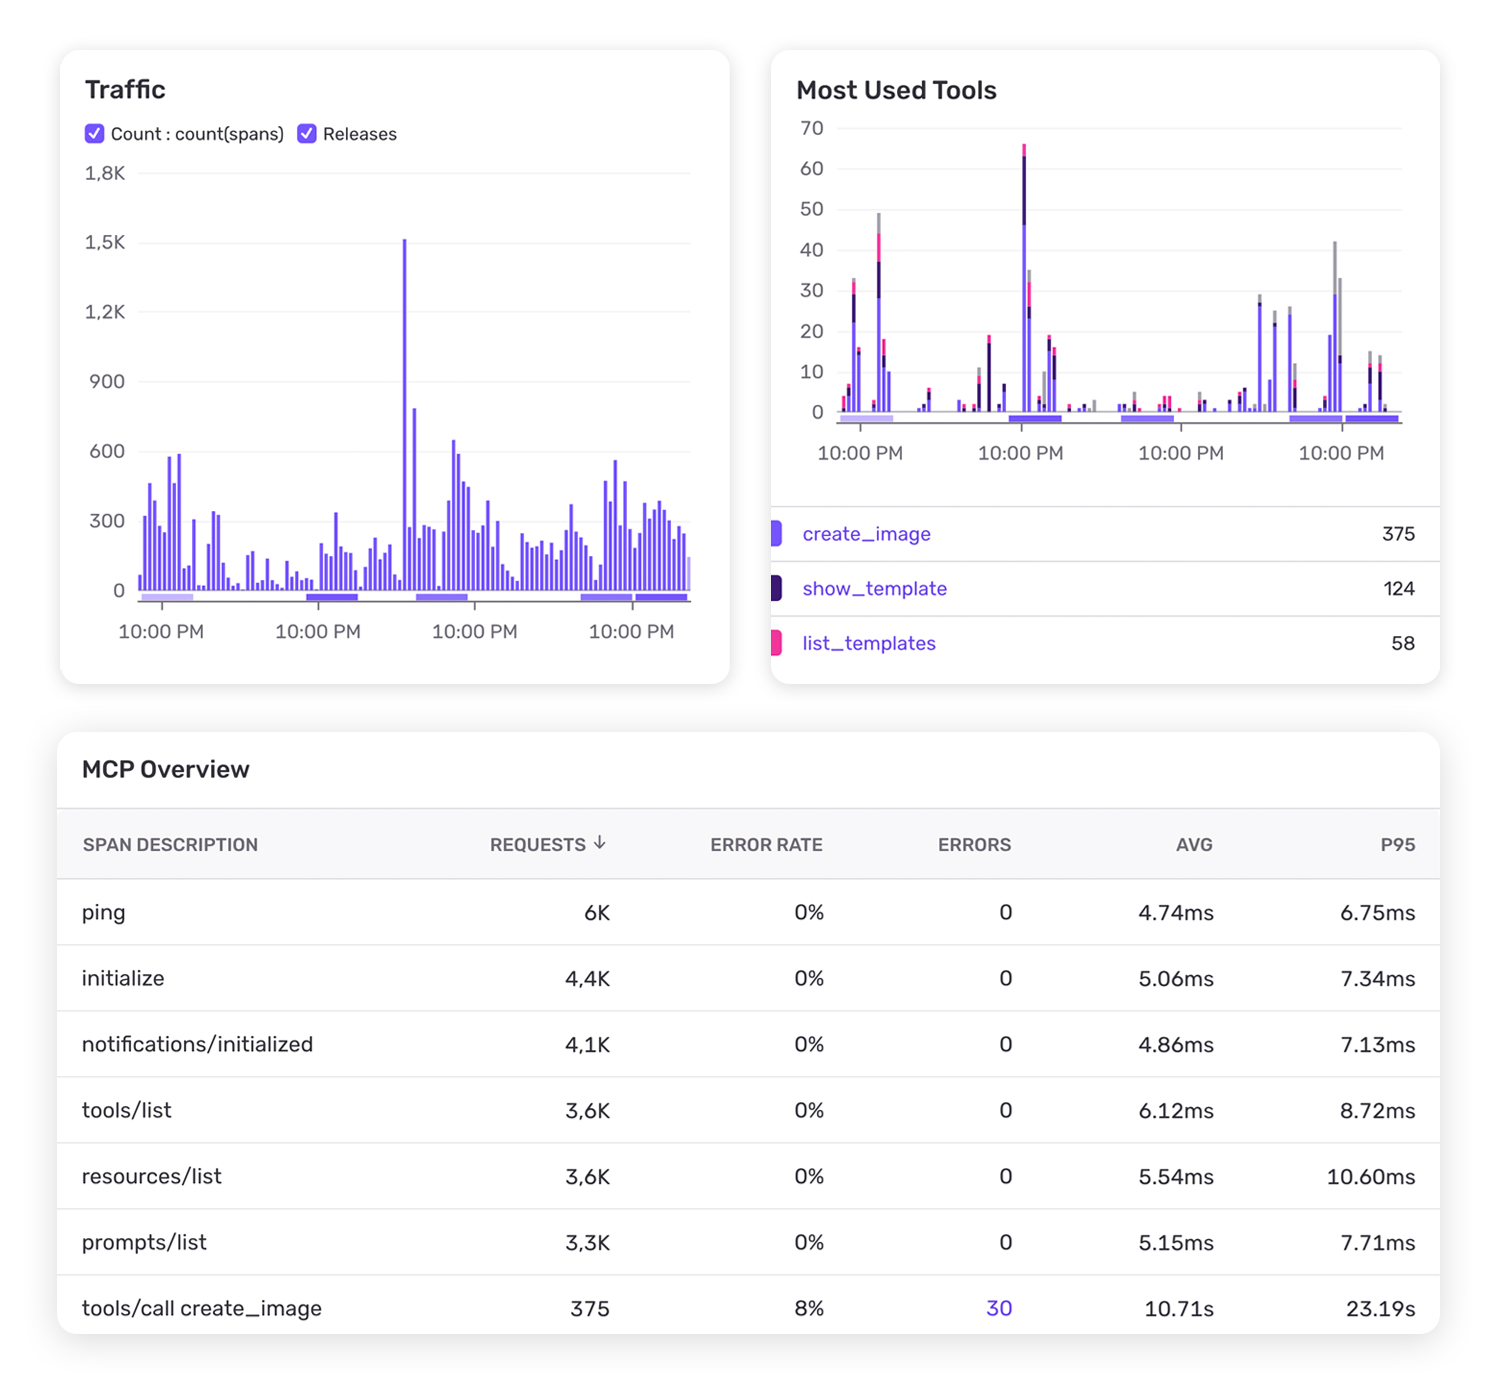
That’s a solid set of data that will help us improve reliability, performance and token efficiency over time. Will that make us popular among AI agents as a target group? Will they recommend us because of great AX? We’re not sure yet.
Build first, optimize always
Monitoring and optimization is great – but rarely our first thought when building something. I think we all need to keep building with and for AI as the ecosystem evolves. But at the end of the day, we’re business owners, too. We need answers to these questions. Observability is the boring part (sorry, monitoring enthusiasts!), but it delivers some of those answers. It turns a black box like an MCP into insights that help us craft good experiences for humans and agents.
As a developer, I am always happy to see that the tools I trust already went 95% of the hard way for me in their dedicated domain, as I try to do in mine. The Laravel middleware was straightforward to build, and Sentry already had everything else in place.
<div class="brick__image-inner "
id="js-image-445"
v-lazy-bg="'https://madewithnetworkfra.fra1.digitaloceanspaces.com/spatie-space-production/29710/sentry-laravel-7.jpg'"
style=" ">
</div>
</div>
<div class="brick__caption">
<div class="brick__caption-upper">
<a href="https://madewithlaravel.com/sentry-laravel" class="brick__title">
Sentry for Laravel
</a>
<span class="brick__tagline">
Laravel Error & Performance Monitoring
</span>
</div>
<div class="brick__caption-lower">
<div class="pull-left">
<a href="/essentials">#Essentials</a>
<a href="/devtools">#DevTools</a>
<a href="/plugins">#Plugins</a>
<span class="dots">...</span>
</div>
<div class="pull-right">
<div class="brick__views">
<svg class="svg-inline u__va--middle" width="20px" height="13px" viewBox="0 0 20 13" version="1.1" xmlns="http://www.w3.org/2000/svg" xmlns:xlink="http://www.w3.org/1999/xlink">
<!-- Generator: Sketch 46.2 (44496) - http://www.bohemiancoding.com/sketch -->
<title>icon-eye-dark</title>
<desc>Created with Sketch.</desc>
<defs></defs>
<g id="Page-1" stroke="none" stroke-width="1" fill="none" fill-rule="evenodd">
<g id="Icons" transform="translate(-313.000000, -230.000000)" fill-rule="nonzero" fill="#435B71">
<g id="icon-eye-dark" transform="translate(313.000000, 230.000000)">
<path d="M9.57827924,0.0932647368 C5.40166592,0.0977121053 2.23909537,3.28527789 0.162366374,6.09013053 C-0.0164829778,6.33193046 -0.0164829778,6.66216481 0.162366374,6.90396474 C2.23923803,9.71401737 5.40085034,12.9011726 9.57827924,12.9068174 C9.57872397,12.9068178 9.57916871,12.9068178 9.57961345,12.9068174 C13.7562192,12.90237 16.9187977,9.71477 18.9955264,6.90995158 C19.1743758,6.66815165 19.1743758,6.3379173 18.9955264,6.09611737 C16.9186536,3.28603053 13.7570499,0.0989094737 9.57961345,0.0932647368 C9.57916871,0.0932643033 9.57872397,0.0932643033 9.57827924,0.0932647368 L9.57827924,0.0932647368 Z M9.57827924,1.46168579 L9.57961345,1.46168579 C12.8675916,1.46681737 15.5988249,3.96846211 17.5569468,6.50236737 C15.5985806,9.03230421 12.8660264,11.5341884 9.57961345,11.5383963 C6.29104758,11.5339489 3.55933568,9.03192789 1.60094367,6.49771474 C3.55930832,3.96777789 6.29185563,1.46589368 9.57827718,1.46168579 L9.57827924,1.46168579 Z" id="Shape"></path>
<path d="M9.57894737,3.42075158 C7.88659608,3.42075158 6.5,4.80737263 6.5,6.49969895 C6.5,8.19205947 7.88659608,9.57864632 9.57894737,9.57864632 C11.2712987,9.57864632 12.6578947,8.19205947 12.6578947,6.49969895 C12.6578947,4.80737263 11.2712987,3.42075158 9.57894737,3.42075158 Z M9.57894737,4.78917263 C10.5317492,4.78917263 11.2894737,5.54690158 11.2894737,6.49969895 C11.2894737,7.45249632 10.5317492,8.21022526 9.57894737,8.21022526 C8.62614555,8.21022526 7.86842105,7.45249632 7.86842105,6.49969895 C7.86842105,5.54690158 8.62614555,4.78917263 9.57894737,4.78917263 Z" id="Shape"></path>
</g>
</g>
</g> </div>Feel free to check out and use our PHP / Laravel middleware SentryMcpTracing.php for MCP observability with Sentry, until an official integration drops 👀