Debugging is part of every developer’s life. The better you are at solving problems, the more efficient you will be. While the basics of debugging are the same for any programming language, you can always use specific tools and get to know best practices.
We’ll round up everything you need to know about debugging with Laravel in this article, including some personal recommendations from our toolkit!
Debugging Basics
What kind of bugs are common in Laravel apps?
If you’re building an app or API, there are many parts where things can go wrong. Here are some common problems:
- Syntax errors like missing semicolons, unclosed quotes, misplaced or missing brackets, extra commas or undefined variables
- Routing issues like incorrect or missing routes and/or parameters
- Database errors like SQL query errors or incorrect column types in your database
- Controller/Model errors like calling undefined methods or forgetting to import controllers/models
- Environment configuration issues like failing database connections caused by errors in your
.envfile - Session or cache issues like timeouts that log out your users unexpectedly or mistakes in storing and retrieving data
- CORS (Cross-Origin Resource Sharing) errors while building APIs, caused by wrong configuration
- Authentication problems that arise from incorrectly defined policies and checks
- Dependency / Composer issues resulting in a class being
not found, often because of an issue with Composer’s autoloading - … and ♾️ more
Debugging process
To find and fix these problems, you will need to go through a few structured steps instead of randomly trying to change your code.
- If you can reproduce the bug you will know what exact action is problematic.
- Ask yourself what is the expected behaviour, and notice what is happening instead.
- Then it’s time to identify the root cause of your bug. This is usually the hardest part - that’s why we have many tools to help us with that step. (Check the next chapter!)
- If you have found the problem, you should now be able to fix your code. Surprisingly, this is usually easy compared to finding the cause!
- Afterwards, verify if your code is now working as intended, deploy your fix and call it a day. Success!
Laravel Debugging Tools
Finding the root cause of a bug is always the most tricky part of debugging, because there are many possible points of failure. We need to start looking for hints like variables with the wrong value, or functions that should have been called but weren’t.
Luckily, debugging tools can help you in the process!
Built-in Tools for Debugging
Laravel comes with some pretty neat debugging tools out of the box:
📄 Logging
Use the Log facade to send messages to log files, the system error log or other channels. You can log errors with the error method, or record details using debug().
Log::error('Error in myControllerMethod', [
    'message' => $e->getMessage(),
    'file' => $e->getFile(),
    'line' => $e->getLine(),
    'trace' => $e->getTrace(),
]);
Log::debug('This is my debug message', [
'some_variable' => $someVariable,
'additional_info' => 'Additional infos',
]);🛑 Dump and Die
With the dd() function (standing for „dump and die“) you can easily investigate what is happening during execution. It lets you dump variable values at a specific point in your script to the browser, and then stop executing at that point.
dd($variable)
That way you can go through the script step by step to see where exactly things are going wrong - for example because some function is not setting the $variable value correctly.
🚧 Exception handling
Laravel records exceptions (which are errors that disrupt the flow of your app’s execution) by default, additionally to errors you log manually with Log::error. Infos about incidents are automatically written to your log files.
If you set the APP_DEBUG in your .env file to true during development (not in production!), you get more information while debugging.
🗄️ SQL query debugging
Since Laravel 10 you can use the toRawSql() / dumpRawSql() / ddRawSql() methods to inspect the SQL queries (including bindings) generated by your app using Laravel’s Eloquent ORM.
$sql = User::where('name', 'Armin')->toRawSql();
dd($sql)

// Alternatively print print the raw queries directly
User::where('name', 'Armin')->ddRawSql();
User::where('name', 'Armin')->dumpRawSql();

// select * from `users`
// where `name` = 'Armin'
More Debug Tools
If you want to add more options to your debugging toolbox, here are some additional recommendations for more efficiency and convenience!
➡️ Laravel Debugbar
The open-source Laravel Debugbar package provides a debug bar right in your app’s UI during development. It lets you inspect database queries, route infos, views and responses and more. You can also view log entries directly in the debug bar.
            <div class="brick__image-inner "
                 id="js-image-421"
                 v-lazy-bg="'https://madewithnetworkfra.fra1.digitaloceanspaces.com/spatie-space-production/31363/laravel-debugbar-2.jpg'"
                style=" ">

            </div>


    </div>

    <div class="brick__caption">
                    <div class="brick__caption-upper">
            <a  href="https://madewithlaravel.com/laravel-debugbar" class="brick__title">
                Laravel Debugbar
            </a>
            <span class="brick__tagline">
            PHP Debug Bar Integration
        </span>
        </div>
        <div class="brick__caption-lower">
            <div class="pull-left">

                                        <a href="/plugins">#Plugins</a>
                                                                <a href="/testing">#Testing</a>
                                                        </div>
            <div class="pull-right">
        <div class="brick__views">
        <svg class="svg-inline u__va--middle" width="20px" height="13px" viewBox="0 0 20 13" version="1.1" xmlns="http://www.w3.org/2000/svg" xmlns:xlink="http://www.w3.org/1999/xlink">
<!-- Generator: Sketch 46.2 (44496) - http://www.bohemiancoding.com/sketch -->
<title>icon-eye-dark</title>
<desc>Created with Sketch.</desc>
<defs></defs>
<g id="Page-1" stroke="none" stroke-width="1" fill="none" fill-rule="evenodd">
    <g id="Icons" transform="translate(-313.000000, -230.000000)" fill-rule="nonzero" fill="#435B71">
        <g id="icon-eye-dark" transform="translate(313.000000, 230.000000)">
            <path d="M9.57827924,0.0932647368 C5.40166592,0.0977121053 2.23909537,3.28527789 0.162366374,6.09013053 C-0.0164829778,6.33193046 -0.0164829778,6.66216481 0.162366374,6.90396474 C2.23923803,9.71401737 5.40085034,12.9011726 9.57827924,12.9068174 C9.57872397,12.9068178 9.57916871,12.9068178 9.57961345,12.9068174 C13.7562192,12.90237 16.9187977,9.71477 18.9955264,6.90995158 C19.1743758,6.66815165 19.1743758,6.3379173 18.9955264,6.09611737 C16.9186536,3.28603053 13.7570499,0.0989094737 9.57961345,0.0932647368 C9.57916871,0.0932643033 9.57872397,0.0932643033 9.57827924,0.0932647368 L9.57827924,0.0932647368 Z M9.57827924,1.46168579 L9.57961345,1.46168579 C12.8675916,1.46681737 15.5988249,3.96846211 17.5569468,6.50236737 C15.5985806,9.03230421 12.8660264,11.5341884 9.57961345,11.5383963 C6.29104758,11.5339489 3.55933568,9.03192789 1.60094367,6.49771474 C3.55930832,3.96777789 6.29185563,1.46589368 9.57827718,1.46168579 L9.57827924,1.46168579 Z" id="Shape"></path>
            <path d="M9.57894737,3.42075158 C7.88659608,3.42075158 6.5,4.80737263 6.5,6.49969895 C6.5,8.19205947 7.88659608,9.57864632 9.57894737,9.57864632 C11.2712987,9.57864632 12.6578947,8.19205947 12.6578947,6.49969895 C12.6578947,4.80737263 11.2712987,3.42075158 9.57894737,3.42075158 Z M9.57894737,4.78917263 C10.5317492,4.78917263 11.2894737,5.54690158 11.2894737,6.49969895 C11.2894737,7.45249632 10.5317492,8.21022526 9.57894737,8.21022526 C8.62614555,8.21022526 7.86842105,7.45249632 7.86842105,6.49969895 C7.86842105,5.54690158 8.62614555,4.78917263 9.57894737,4.78917263 Z" id="Shape"></path>
        </g>
    </g>
</g> </div>➡️ Xdebug
Xdebug is an open-source debugging and profiling tool for PHP. It comes with many useful features, for example step debugging (executing your script step by step) and setting breakpoints to stop execution and inspect variables. That's very handy if you have absolutely no clue where things are going wrong yet.
Many IDEs like PhpStorm offer Xdebug extensions / integrations.
➡️ Ray
Once you have used Ray, you may not want to go back to traditional logging. (We don’t!)
Ray allows you to send logging information to its companion app in real-time, beautifully formatting your strings, arrays and objects. It also lets you filter, group and color-code your dumps.
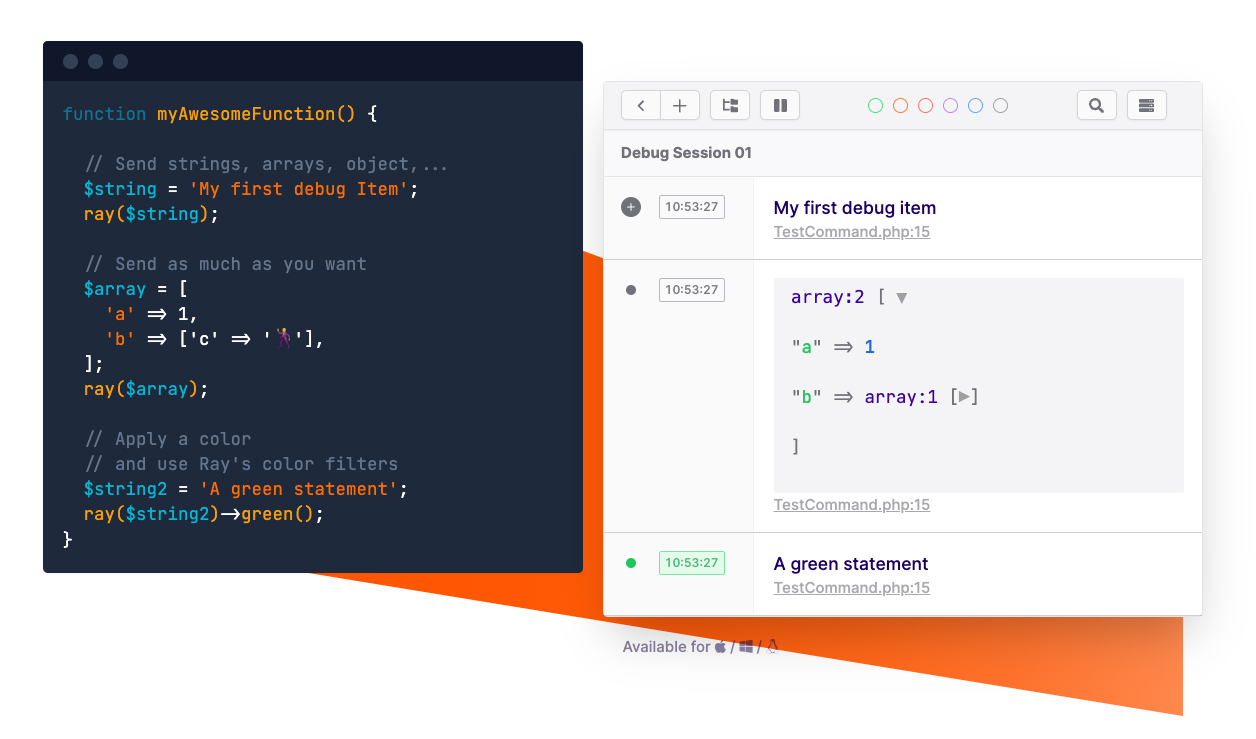
It’s designed specifically for Laravel and can be used with Laravel and Lumen, or alongside Laravel’s Tinker REPL.
            <div class="brick__image-inner "
                 id="js-image-2778"
                 v-lazy-bg="'https://madewithnetworkfra.fra1.digitaloceanspaces.com/spatie-space-production/23718/ray.jpg'"
                style=" ">

            </div>


    </div>

    <div class="brick__caption">
                    <div class="brick__caption-upper">
            <a  href="https://madewithlaravel.com/ray" class="brick__title">
                Ray
            </a>
            <span class="brick__tagline">
            Dump Debugging App
        </span>
        </div>
        <div class="brick__caption-lower">
            <div class="pull-left">

                                        <a href="/essentials">#Essentials</a>
                                                                <a href="/ide">#IDE</a>
                                                                <a href="/app">#App</a>
                                                        </div>
            <div class="pull-right">
        <div class="brick__views">
        <svg class="svg-inline u__va--middle" width="20px" height="13px" viewBox="0 0 20 13" version="1.1" xmlns="http://www.w3.org/2000/svg" xmlns:xlink="http://www.w3.org/1999/xlink">
<!-- Generator: Sketch 46.2 (44496) - http://www.bohemiancoding.com/sketch -->
<title>icon-eye-dark</title>
<desc>Created with Sketch.</desc>
<defs></defs>
<g id="Page-1" stroke="none" stroke-width="1" fill="none" fill-rule="evenodd">
    <g id="Icons" transform="translate(-313.000000, -230.000000)" fill-rule="nonzero" fill="#435B71">
        <g id="icon-eye-dark" transform="translate(313.000000, 230.000000)">
            <path d="M9.57827924,0.0932647368 C5.40166592,0.0977121053 2.23909537,3.28527789 0.162366374,6.09013053 C-0.0164829778,6.33193046 -0.0164829778,6.66216481 0.162366374,6.90396474 C2.23923803,9.71401737 5.40085034,12.9011726 9.57827924,12.9068174 C9.57872397,12.9068178 9.57916871,12.9068178 9.57961345,12.9068174 C13.7562192,12.90237 16.9187977,9.71477 18.9955264,6.90995158 C19.1743758,6.66815165 19.1743758,6.3379173 18.9955264,6.09611737 C16.9186536,3.28603053 13.7570499,0.0989094737 9.57961345,0.0932647368 C9.57916871,0.0932643033 9.57872397,0.0932643033 9.57827924,0.0932647368 L9.57827924,0.0932647368 Z M9.57827924,1.46168579 L9.57961345,1.46168579 C12.8675916,1.46681737 15.5988249,3.96846211 17.5569468,6.50236737 C15.5985806,9.03230421 12.8660264,11.5341884 9.57961345,11.5383963 C6.29104758,11.5339489 3.55933568,9.03192789 1.60094367,6.49771474 C3.55930832,3.96777789 6.29185563,1.46589368 9.57827718,1.46168579 L9.57827924,1.46168579 Z" id="Shape"></path>
            <path d="M9.57894737,3.42075158 C7.88659608,3.42075158 6.5,4.80737263 6.5,6.49969895 C6.5,8.19205947 7.88659608,9.57864632 9.57894737,9.57864632 C11.2712987,9.57864632 12.6578947,8.19205947 12.6578947,6.49969895 C12.6578947,4.80737263 11.2712987,3.42075158 9.57894737,3.42075158 Z M9.57894737,4.78917263 C10.5317492,4.78917263 11.2894737,5.54690158 11.2894737,6.49969895 C11.2894737,7.45249632 10.5317492,8.21022526 9.57894737,8.21022526 C8.62614555,8.21022526 7.86842105,7.45249632 7.86842105,6.49969895 C7.86842105,5.54690158 8.62614555,4.78917263 9.57894737,4.78917263 Z" id="Shape"></path>
        </g>
    </g>
</g> </div>➡️ Laravel Telescope
Laravel Telescope is an open-source debug assistant that provides a nice visual dashboard for your debugging data.
It can show insights about requests, exceptions, logs, queries, jobs, mails, notifications and more. You can configure so-called „watchers“ to tell Telescope to gather the data you need, and even extend it with custom monitors.
            <div class="brick__image-inner "
                 id="js-image-1310"
                 v-lazy-bg="'https://madewithnetworkfra.fra1.digitaloceanspaces.com/spatie-space-production/2879/laravel-telescope.jpg'"
                style=" ">

            </div>


    </div>

    <div class="brick__caption">
                    <div class="brick__caption-upper">
            <a  href="https://madewithlaravel.com/laravel-telescope" class="brick__title">
                Laravel Telescope
            </a>
            <span class="brick__tagline">
            Elegant Debug Assistant
        </span>
        </div>
        <div class="brick__caption-lower">
            <div class="pull-left">

                                        <a href="/testing">#Testing</a>
                                                        </div>
            <div class="pull-right">
        <div class="brick__views">
        <svg class="svg-inline u__va--middle" width="20px" height="13px" viewBox="0 0 20 13" version="1.1" xmlns="http://www.w3.org/2000/svg" xmlns:xlink="http://www.w3.org/1999/xlink">
<!-- Generator: Sketch 46.2 (44496) - http://www.bohemiancoding.com/sketch -->
<title>icon-eye-dark</title>
<desc>Created with Sketch.</desc>
<defs></defs>
<g id="Page-1" stroke="none" stroke-width="1" fill="none" fill-rule="evenodd">
    <g id="Icons" transform="translate(-313.000000, -230.000000)" fill-rule="nonzero" fill="#435B71">
        <g id="icon-eye-dark" transform="translate(313.000000, 230.000000)">
            <path d="M9.57827924,0.0932647368 C5.40166592,0.0977121053 2.23909537,3.28527789 0.162366374,6.09013053 C-0.0164829778,6.33193046 -0.0164829778,6.66216481 0.162366374,6.90396474 C2.23923803,9.71401737 5.40085034,12.9011726 9.57827924,12.9068174 C9.57872397,12.9068178 9.57916871,12.9068178 9.57961345,12.9068174 C13.7562192,12.90237 16.9187977,9.71477 18.9955264,6.90995158 C19.1743758,6.66815165 19.1743758,6.3379173 18.9955264,6.09611737 C16.9186536,3.28603053 13.7570499,0.0989094737 9.57961345,0.0932647368 C9.57916871,0.0932643033 9.57872397,0.0932643033 9.57827924,0.0932647368 L9.57827924,0.0932647368 Z M9.57827924,1.46168579 L9.57961345,1.46168579 C12.8675916,1.46681737 15.5988249,3.96846211 17.5569468,6.50236737 C15.5985806,9.03230421 12.8660264,11.5341884 9.57961345,11.5383963 C6.29104758,11.5339489 3.55933568,9.03192789 1.60094367,6.49771474 C3.55930832,3.96777789 6.29185563,1.46589368 9.57827718,1.46168579 L9.57827924,1.46168579 Z" id="Shape"></path>
            <path d="M9.57894737,3.42075158 C7.88659608,3.42075158 6.5,4.80737263 6.5,6.49969895 C6.5,8.19205947 7.88659608,9.57864632 9.57894737,9.57864632 C11.2712987,9.57864632 12.6578947,8.19205947 12.6578947,6.49969895 C12.6578947,4.80737263 11.2712987,3.42075158 9.57894737,3.42075158 Z M9.57894737,4.78917263 C10.5317492,4.78917263 11.2894737,5.54690158 11.2894737,6.49969895 C11.2894737,7.45249632 10.5317492,8.21022526 9.57894737,8.21022526 C8.62614555,8.21022526 7.86842105,7.45249632 7.86842105,6.49969895 C7.86842105,5.54690158 8.62614555,4.78917263 9.57894737,4.78917263 Z" id="Shape"></path>
        </g>
    </g>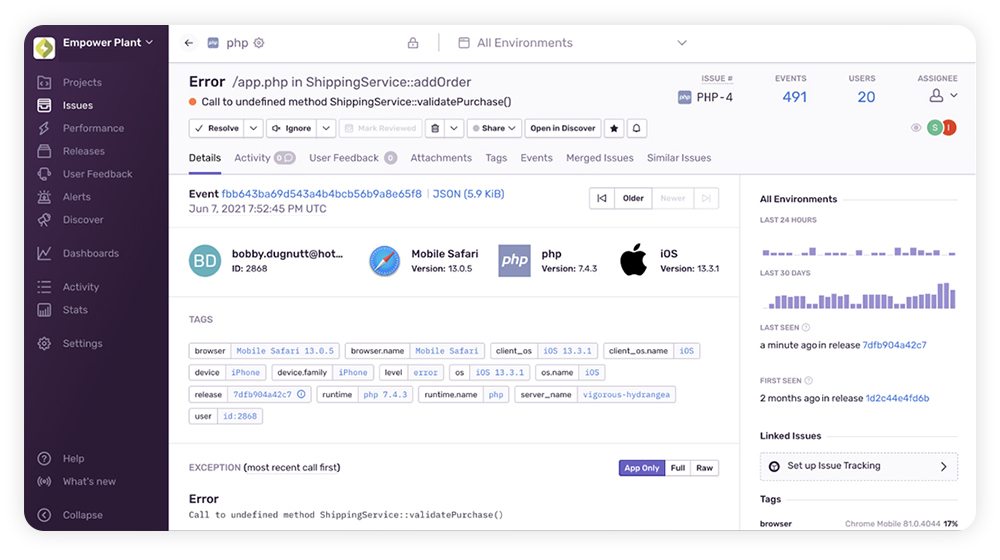
</g> </div>➡️ Error monitoring services: Laravel Flare, Sentry & more
Error monitoring services help you catch bugs in production. They automatically report and gather insights about errors, exceptions and performance bottlenecks that occur while users are using your app.
There are many services you can choose from, depending on your app and requirements. The exception tracker Flare for example is exclusively focused on Laravel and integrates very well with the ecosystem.
            <div class="brick__image-inner "
                 id="js-image-1710"
                 v-lazy-bg="'https://madewithnetworkfra.fra1.digitaloceanspaces.com/spatie-space-production/30157/flare-2.jpg'"
                style=" ">

            </div>


    </div>

    <div class="brick__caption">
                    <div class="brick__caption-upper">
            <a  href="https://madewithlaravel.com/flare" class="brick__title">
                Flare
            </a>
            <span class="brick__tagline">
            Error Tracker
        </span>
        </div>
        <div class="brick__caption-lower">
            <div class="pull-left">

                                        <a href="/devtools">#DevTools</a>
                                                                <a href="/app">#App</a>
                                                        </div>
            <div class="pull-right">
        <div class="brick__views">
        <svg class="svg-inline u__va--middle" width="20px" height="13px" viewBox="0 0 20 13" version="1.1" xmlns="http://www.w3.org/2000/svg" xmlns:xlink="http://www.w3.org/1999/xlink">
<!-- Generator: Sketch 46.2 (44496) - http://www.bohemiancoding.com/sketch -->
<title>icon-eye-dark</title>
<desc>Created with Sketch.</desc>
<defs></defs>
<g id="Page-1" stroke="none" stroke-width="1" fill="none" fill-rule="evenodd">
    <g id="Icons" transform="translate(-313.000000, -230.000000)" fill-rule="nonzero" fill="#435B71">
        <g id="icon-eye-dark" transform="translate(313.000000, 230.000000)">
            <path d="M9.57827924,0.0932647368 C5.40166592,0.0977121053 2.23909537,3.28527789 0.162366374,6.09013053 C-0.0164829778,6.33193046 -0.0164829778,6.66216481 0.162366374,6.90396474 C2.23923803,9.71401737 5.40085034,12.9011726 9.57827924,12.9068174 C9.57872397,12.9068178 9.57916871,12.9068178 9.57961345,12.9068174 C13.7562192,12.90237 16.9187977,9.71477 18.9955264,6.90995158 C19.1743758,6.66815165 19.1743758,6.3379173 18.9955264,6.09611737 C16.9186536,3.28603053 13.7570499,0.0989094737 9.57961345,0.0932647368 C9.57916871,0.0932643033 9.57872397,0.0932643033 9.57827924,0.0932647368 L9.57827924,0.0932647368 Z M9.57827924,1.46168579 L9.57961345,1.46168579 C12.8675916,1.46681737 15.5988249,3.96846211 17.5569468,6.50236737 C15.5985806,9.03230421 12.8660264,11.5341884 9.57961345,11.5383963 C6.29104758,11.5339489 3.55933568,9.03192789 1.60094367,6.49771474 C3.55930832,3.96777789 6.29185563,1.46589368 9.57827718,1.46168579 L9.57827924,1.46168579 Z" id="Shape"></path>
            <path d="M9.57894737,3.42075158 C7.88659608,3.42075158 6.5,4.80737263 6.5,6.49969895 C6.5,8.19205947 7.88659608,9.57864632 9.57894737,9.57864632 C11.2712987,9.57864632 12.6578947,8.19205947 12.6578947,6.49969895 C12.6578947,4.80737263 11.2712987,3.42075158 9.57894737,3.42075158 Z M9.57894737,4.78917263 C10.5317492,4.78917263 11.2894737,5.54690158 11.2894737,6.49969895 C11.2894737,7.45249632 10.5317492,8.21022526 9.57894737,8.21022526 C8.62614555,8.21022526 7.86842105,7.45249632 7.86842105,6.49969895 C7.86842105,5.54690158 8.62614555,4.78917263 9.57894737,4.78917263 Z" id="Shape"></path>
        </g>
    </g>
</g> </div>