Imagine throwing the power of 200 machines onto a queue of jobs, and nothing is moving. No failures, no exceptions, just workers sitting there (seemingly) idly, contemplating life while the queue grows. The autoscaler tries to solve it with more capacity – more machines, but throughput stays flat. Fun times!
I’m going to share what we learned from that incident, and how we set up lifecycle logging for our autoscaling infrastructure so we can debug workers that only live for 20 minutes at a time. For the thrill, there’s also an AI agent involved that helps us with analyzing our logging data.
The problem: Nothing broke, nothing worked
When something breaks, you can track and fix it. It’s more difficult when nothing is actually broken. This incident was not a crash. There was just a growing queue and a fleet of seemingly healthy workers. Nothing in that scenario raises an error, because nothing has technically gone wrong. But still: Our customer’s jobs were not getting done.
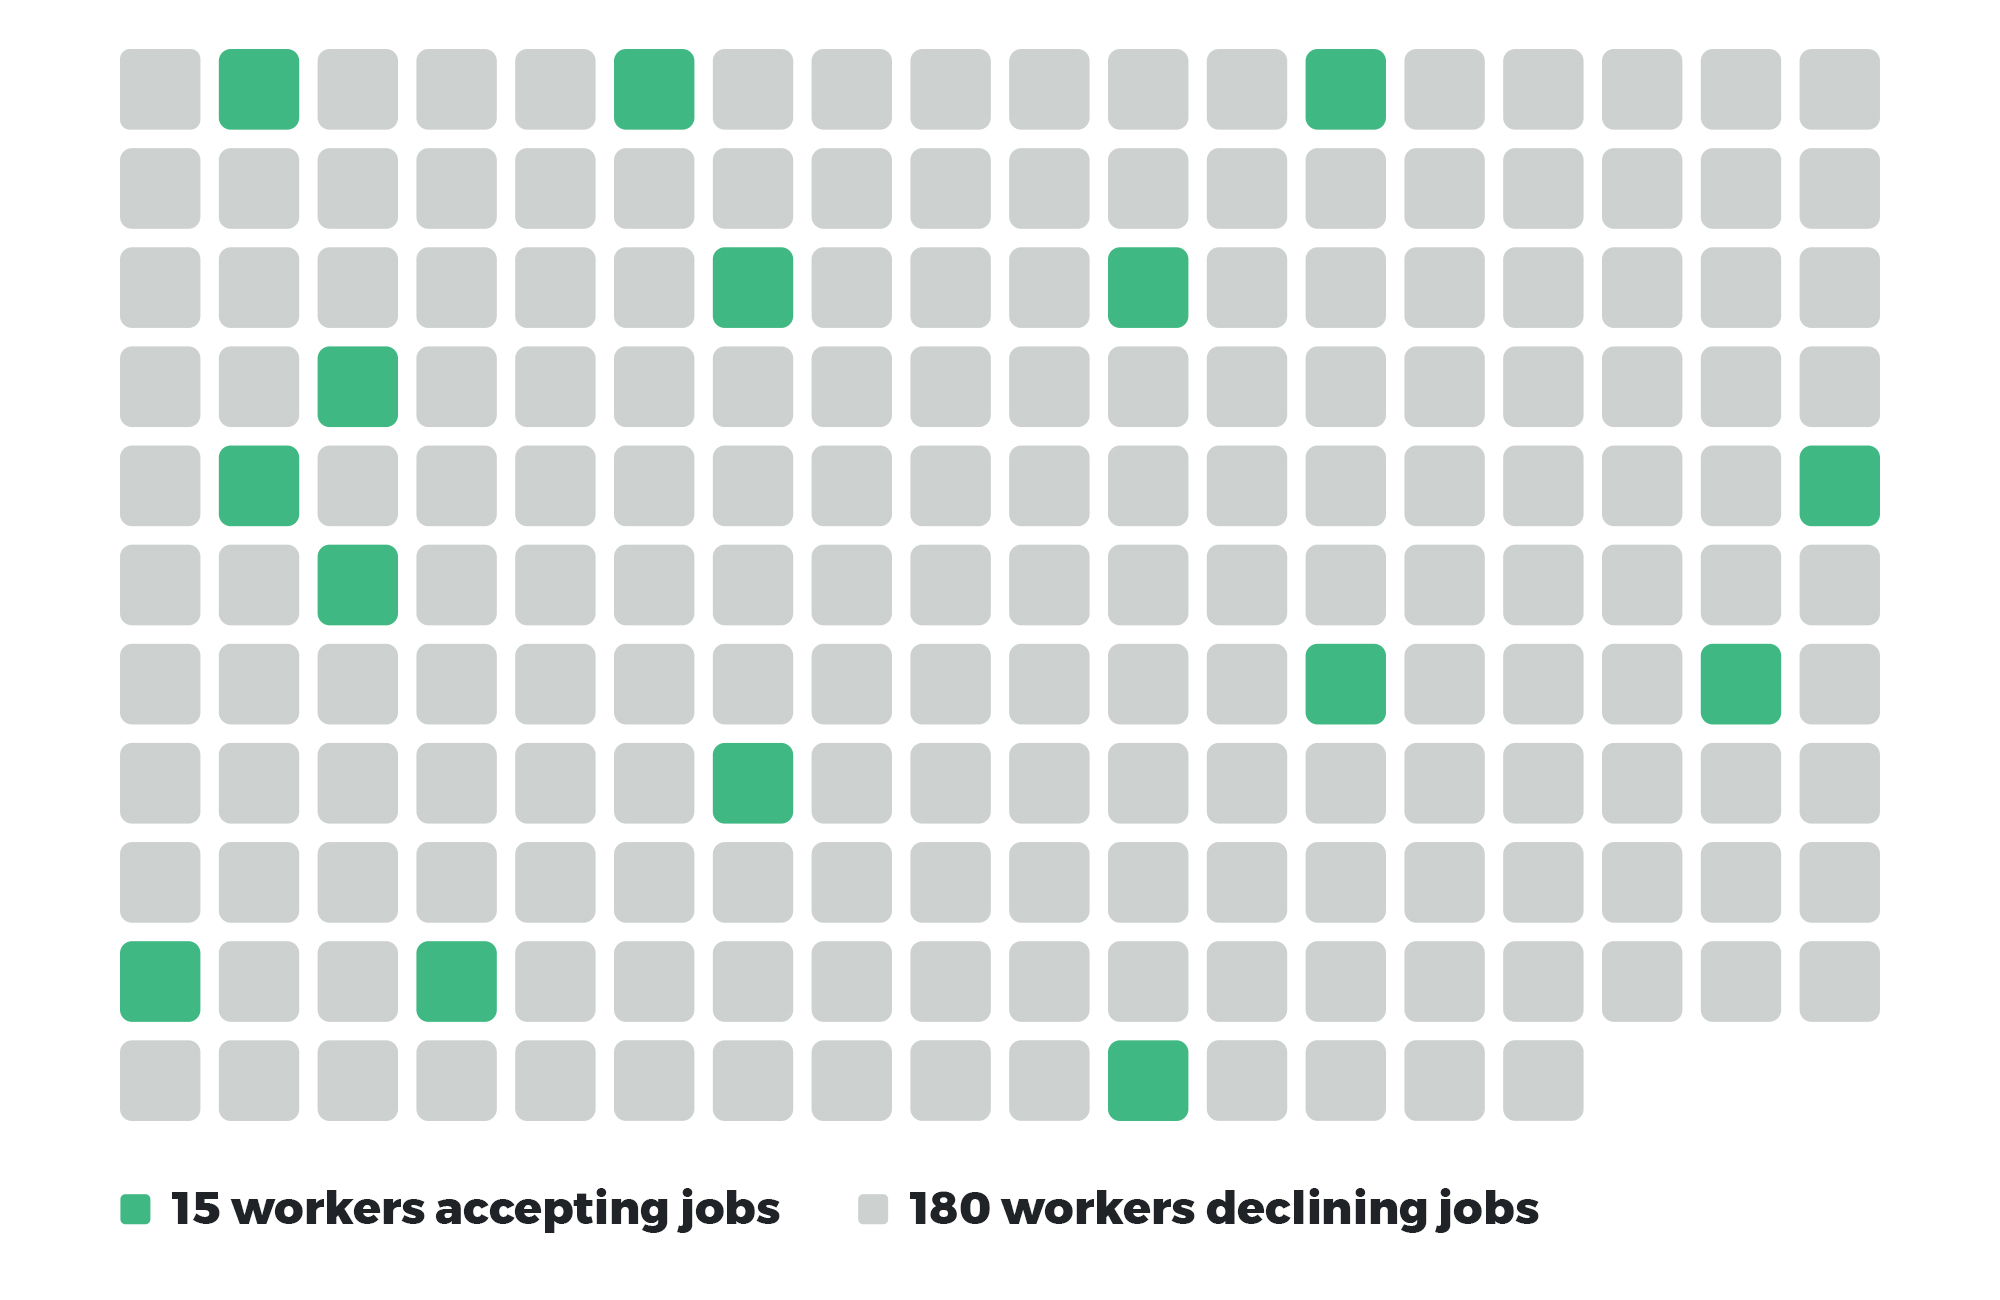
What we found out after an afternoon of swearing: The queue depth increase was caused by our workers having stopped accepting jobs for a valid reason. It started with a customer pushing a high volume of videos through the render queue of our Laravel-based creative automation API placid.app.
Normally, a worker takes a video and extracts single frames to be processed and rendered into the end result. With the videos of the customer being very long and high-res, the frame extraction via FFmpeg was producing a lot more load than usual. The CPUs were being blocked, and the disks of the machines filled up with extracted frames. That caused the load guards of the workers to trip, and refuse to take on more jobs (as they should have).
It took us some hours to understand the mechanism, and with a scaled-up army of idle workers, those hours were expensive. To prevent this from happening again, we changed how heavy jobs like FFmpeg frame extractions are scheduled: Each worker takes only one at a time, and a single customer can only take up a limited share of them. (Obvious in hindsight, as these things usually are.) The customer’s remaining jobs wait in the queue instead of blocking the whole fleet. When heavy jobs pile up, we scale up for exactly that workload.
The new scheduling rules fixed that specific kind of event. But we also wanted something that makes the next worker-related issue easier to explain and fix. Repeat that experience of manually SSH-ing into the machines to connect the dots? No, thank you.
The missing puzzle piece was something that could judge whether a worker is idle and available, or is declining work.
The fix: Lifecycle logging for queue workers
We fixed that by introducing structured lifecycle logs. One line every time a worker changes state, logged by the job pickup check that runs constantly anyway.
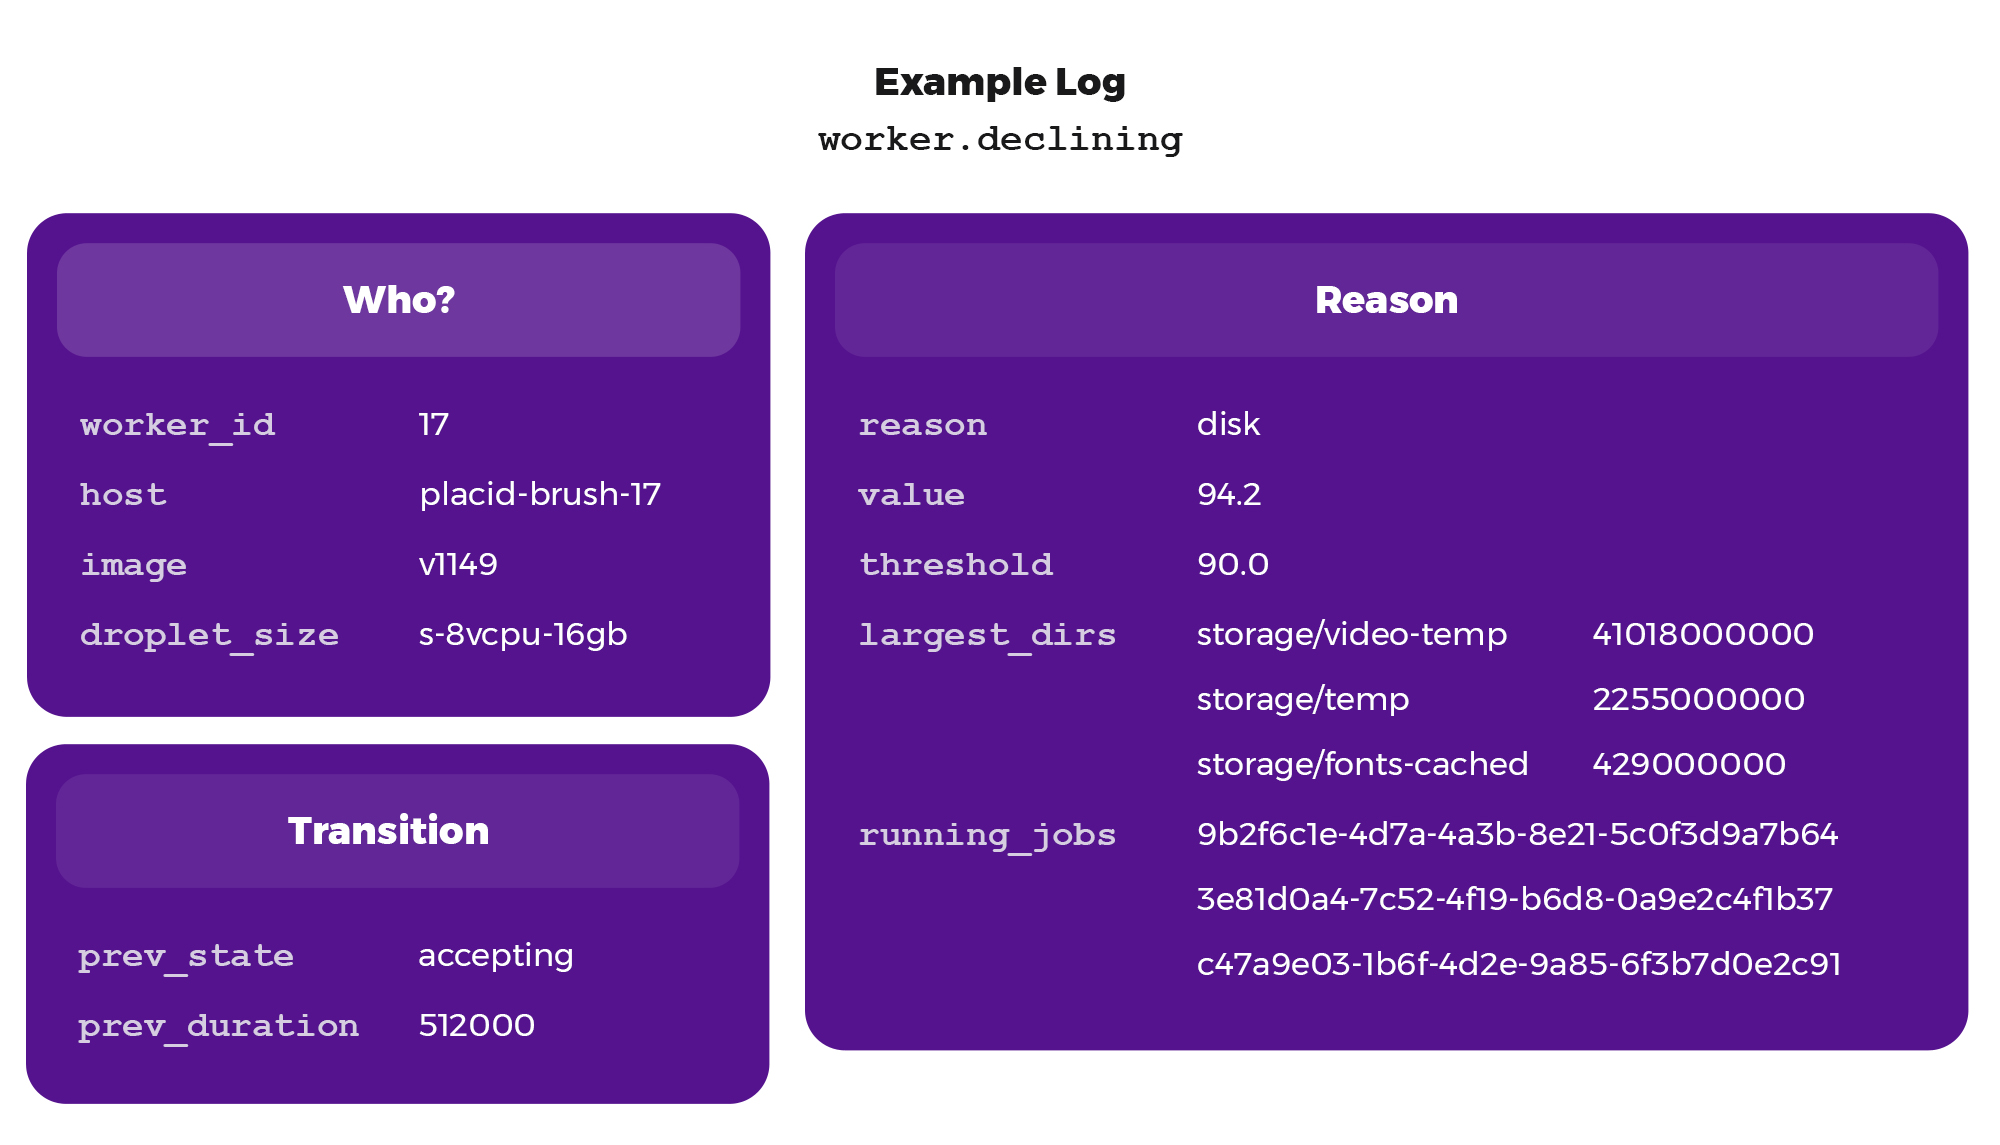
worker.ready: Boot ID, host, image versionworker.accepting: Time spent in the previous stateworker.declining: Reason (load, disk, drain) with the value and the thresholdworker.drained: Time spent accepting, jobs completed, what triggered the drainworker.shutdown: Boot ID, total lifetime, jobs completed, clean or not
We send them straight to Sentry, where our errors and traces already go.
Sentry for Laravel
Laravel Error & Performance Monitoring
16.671
(Disclaimer: Sentry is sponsoring madewithlaravel.com, but we have been using it forever!)
These records and their custom attributes let us stitch together a continuous timeline per worker. The worker ID makes them uniquely identifiable. The most important info is the reason logged with a worker.declining event – that makes it queryable and helps us quickly understand why it’s declining to take on jobs.
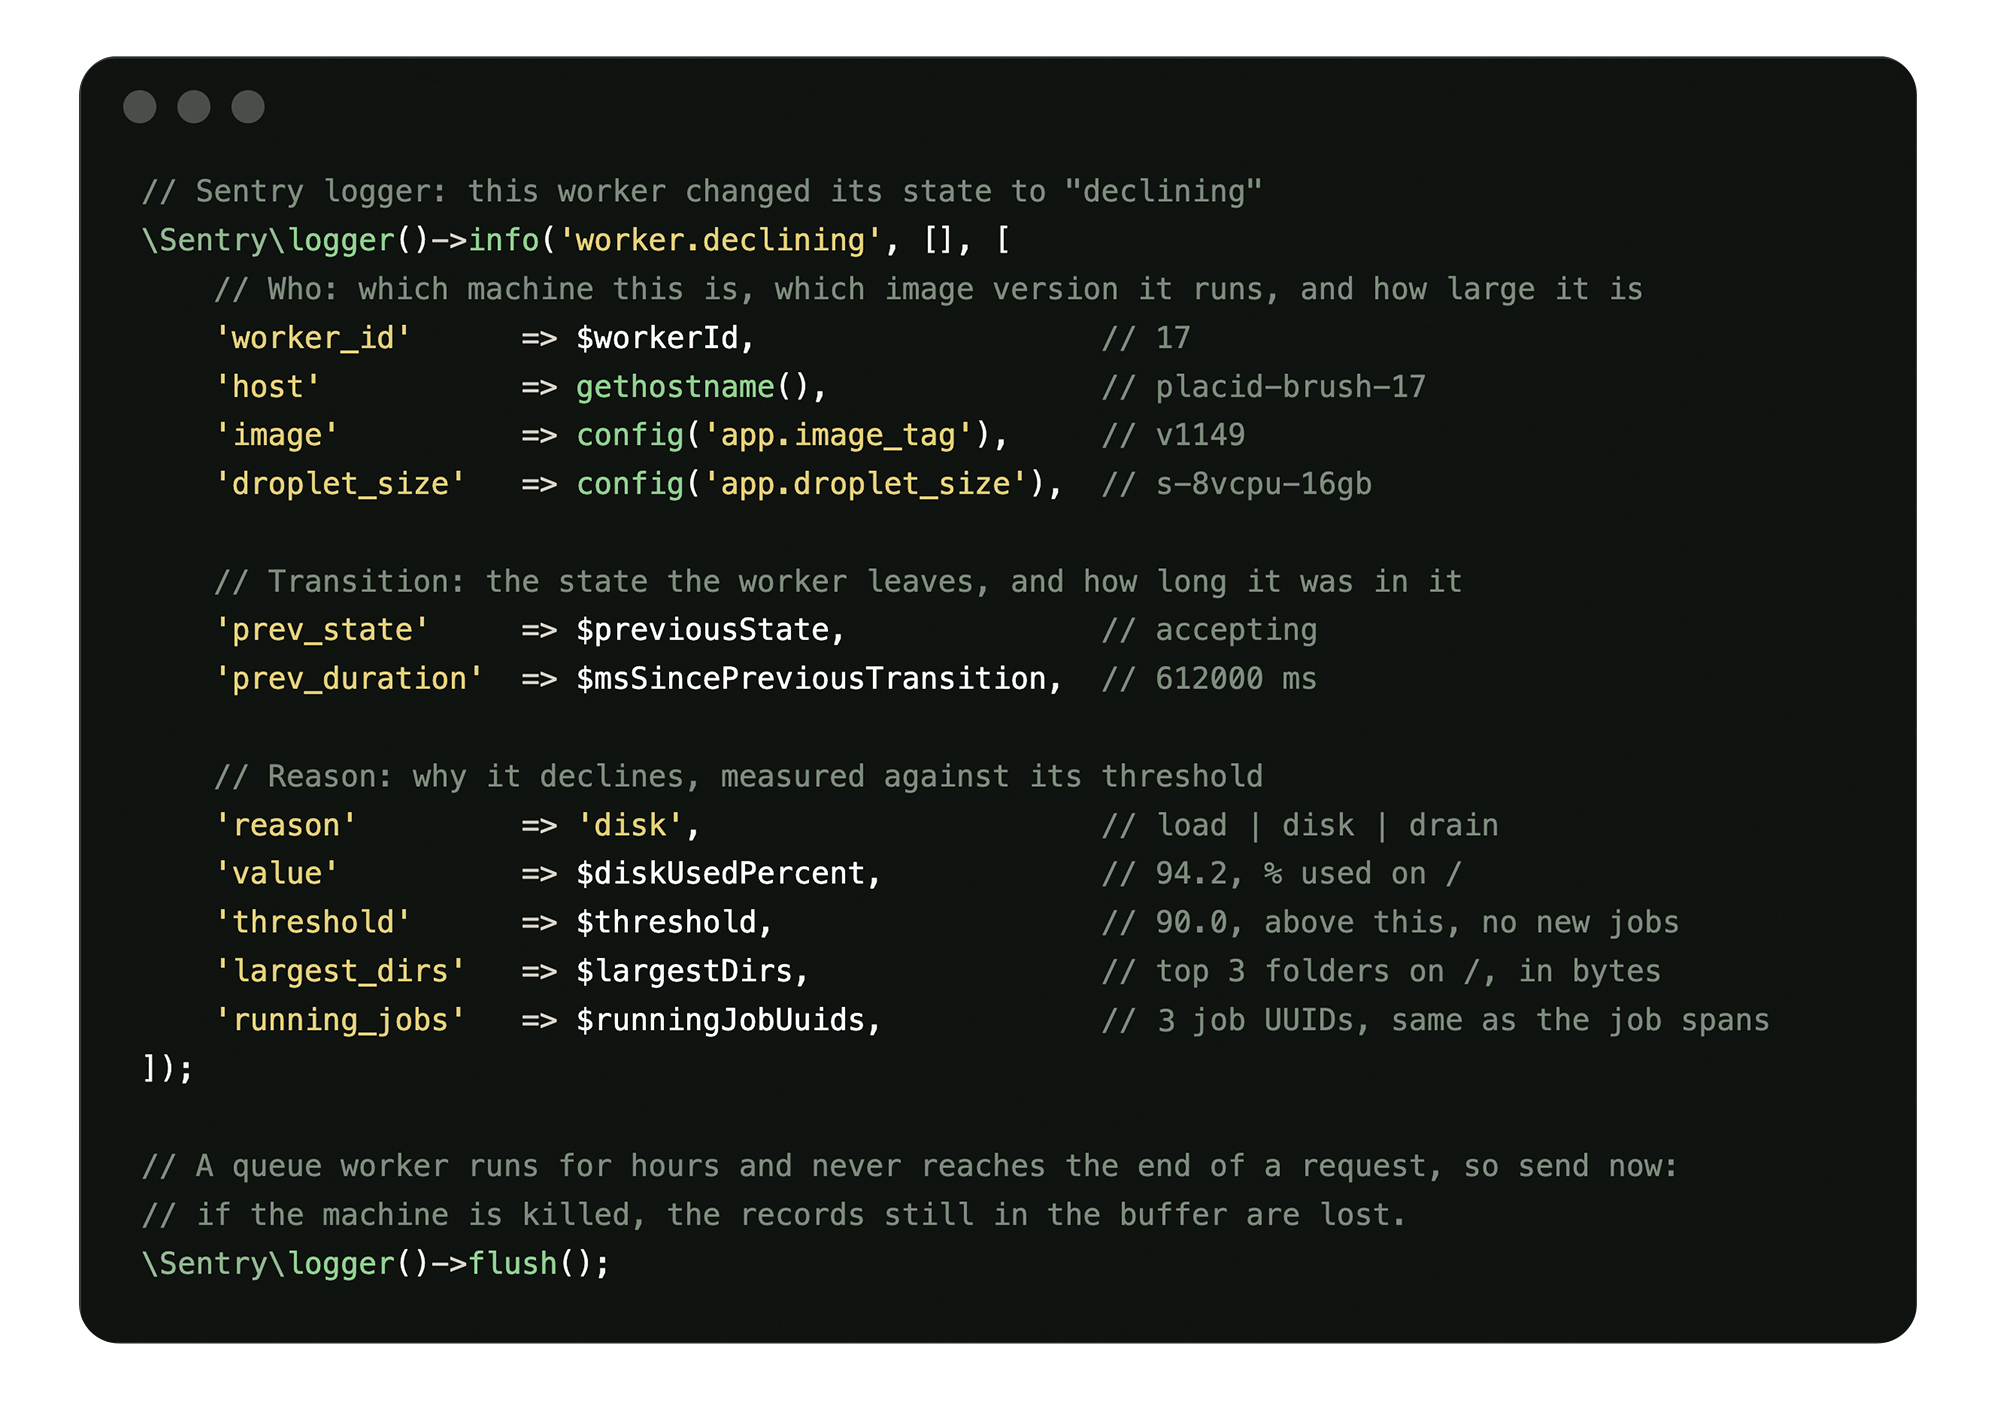
In case a worker gets killed, we flush the worker.declining and worker.drained logs as they’re written rather than at the end of the job to make sure we have those records.
The pickup check runs every couple of seconds. Because we only log the state change instead of the current state, we’re only saving two records instead of twenty-five for a 50-second job refusal. That way, the logs add up to only a few hundred records an hour for us.
The bonus: Perfect data for agent-assisted debugging
Before we added the lifecycle logging, we could not have answered a customer’s question about why 6 of the 40 videos they rendered last week were slow – the machines didn’t even exist anymore! They did not throw any errors, obviously, so there was no way of debugging that.
Now we can find answers by looking at the history of the fleet at the job’s timestamps. Would we ever have done that manually for a support ticket? Probably not, to be honest, if it was a single report and general performance looked fine. Instead, we would have suspected a temporary overload with nothing urgent to fix.
Pulling the records is not the problem, as that’s just a query. But working out what the workers of the 6 slow renders share that the other 34 didn’t is tedious comparison work. Do you know who is great at doing that? Yeah, agents. Now we do a lot of AI-assisted investigations, as they can go through the data quickly and find likely explanations.
In the case of the slow renders, they could have detected a bad image version, for example, by correlating slow jobs against the image version in each boot ID’s records. That’s easily fixed if you know it, and prevents more slow renders immediately.
Where does your system decide not to do something?
If you take one thing with you from this article: Ask yourself where in your system a component can decide not to work (guards, circuit breakers, rate limiters...) and make those decisions visible. Log the state transition and the reason, and you might save future-you an afternoon. In the case of an autoscaling infrastructure like ours, it also gives you a way to debug ephemeral workers.
Exception tracking and monitoring are useful, until you run into a scenario where nothing really broke, but there’s still a problem to be fixed.